If you’ve followed me over the past year, you know that my “AGI” model as I decided to name it has been my child. My goal with this was always to create a tool to predict college football games, especially against the spread, in order to forecast seasons and games every weekend. Not to toot my own horn, but building something from scratch that has the ability to even do a decent job is something I’m pretty proud of. In 2017, the first year of the model, it did not fair exactly how I expected, but let’s take a look at what it got right and (very) wrong.
Overall Numbers
Out of the 815 regular season FBS football games last season, AGI hit at a 69% (nice) clip on picking outright winners, with an overall record of 562-253. Getting a little over two-thirds of games right is alright, but I feel like the average college football fan is able to at least match that. I’d like to get that up to about 80%. Against the spread, the main point of creating the model, it faired just slightly over average, winning 51% of the time.
Teams AGI Nailed
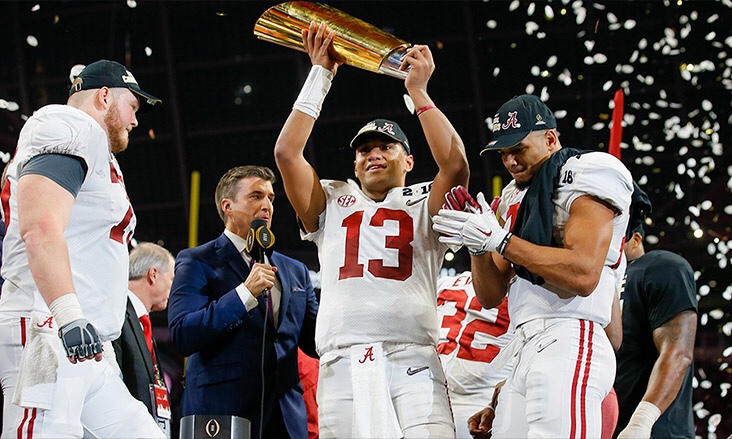
Alabama: While the model did not quite account for Georgia ending up as good as they were, it still had Bama winning the national championship for whatever that’s worth. That was the easy pick though.
College Football Playoff: With a projected playoff field of Alabama, Ohio State, USC, and Florida State, the model only correctly chose one team, but two of those others finished as top 10 teams in New Year’s Six bowls at the end of the season. After accounting for the Francois injury, Oklahoma was the 4th team to slid into the playoff. This all shows just how small the margin of error is in college football.
West Virginia: Ha, suck it. I got ridiculed last year for having West Virginia as a 6-6 team despite them being ranked in the preseason top 25 poll. They ended up finishing 7-5 with the only game I had wrong being a loss to Baylor, who they only beat by two.
Oklahoma vs TCU, Ohio State vs. Wisconsin: Getting two of the conference championships right with the correct winners picked isn’t bad. Especially with a TCU team that wasn’t expected to be here.
What It Missed
Clemson: Woof. This may have been the roughest one. The team that went on to win the ACC and make the playoff was only listed as a 10-2 team by AGI due to the loss of Deshaun Watson. It underestimated these Tigers, but don’t expect that to happen again this year.
Tennessee: Not quite sure why, but AGI really liked the Vols for some reason. While it had them as an 8-4 team, they ended up not winning a single SEC game in 2017. Whoops.
Georgia: Staying in the SEC East, I did not see Georgia coming at all. They were booked as an 8-4 team by AGI and vastly outperformed that, going 11-1 in the regular season in route to an SEC Title.
Stanford: Not sure why, but this was another team I was against all year. The model had them pegged as a 7-5 team despite playing for the Pac 12 title. Now they did go 8-4 in the end, but this was still better than I expected.
While these were the biggest hits/misses, there were defintely more on both sides. Overall, I feel like year one of this experiment was pretty successful. The 2018 version of AGI, with a brand new formula and calculation method, will be unveiled tomorrow, August 30th, just in time for the season. Stay tuned and follow me on Twitter @CodyGoggin for updates all season long.


